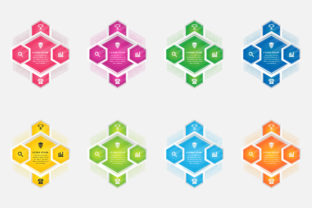
Unlocking the Power of the Infographics Hexagon Pattern
Have you ever noticed how some infographics instantly draw you in while others feel cluttered or forgettable? The difference often lies not in the data itself, but in the underlying structure. One of the most effective and visually compelling frameworks emerging in information design is the Infographics Hexagon Pattern. Instead of relying on traditional bars, circles, or linear timelines, this approach uses interlocking hexagons to create a modular, honeycomb-like layout. It is a design principle that merges geometry with storytelling, and it is gaining traction because it solves a real problem: how to make complex information feel both orderly and engaging at a glance.
The hexagon pattern matters now more than ever. With information overload affecting professionals, creators, and everyday readers, clarity has become a premium. A hexagonal grid naturally guides the eye across a visual field in multiple directions, unlike a rigid column or row. This flexibility allows designers to show relationships, hierarchies, and flows without forcing the viewer to follow a single path. Whether you are a marketer explaining a product ecosystem, an educator breaking down a scientific process, or a freelancer presenting portfolio highlights, the hexagonal block offers a familiar yet fresh container for your story.
Why the Hexagon? Geometry Meets Information Design
The hexagon is not a random shape. Nature favors it—from beehives to basalt columns—because it packs the maximum area with minimal perimeter. In infographics, that efficiency translates into visual economy. Each hexagon acts as a self-contained module that still connects to its neighbors, creating a network of information without wasted white space. This is especially useful when you need to show how different pieces of data relate to one another without implying a strict sequential order.
For example, a business consultant mapping out a company’s strategic pillars might use six hexagons: one for customer focus, one for innovation, one for operations, and so on. The adjacency of each shape can indicate overlap or synergy, while the overall pattern reinforces the idea that all pillars support the same goal. No single hexagon dominates the layout, which encourages a more democratic, systems-thinking view of the topic.
Visual Hierarchy Without Rigid Lines
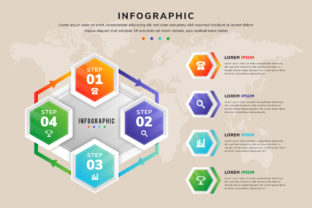
Traditional infographic patterns often rely on left-to-right or top-to-bottom reading. The hexagon pattern disrupts that expectation in a positive way. By arranging hexagons in a honeycomb, you can create a central hub flanked by supporting cells. The eye naturally orbits the hub, then moves outward to connected clusters. This makes the pattern ideal for explaining ecosystems, processes that have multiple parallel steps, or concepts that are best understood as a web of interconnected ideas.
A real-world example comes from environmental organizations that use hexagon infographics to illustrate the ripple effects of climate change. One hexagon might represent “rising temperatures,” connected to hexagons for “glacial melt,” “habitat loss,” and “extreme weather.” The lack of a strict linear order allows viewers to start anywhere and follow their curiosity, which increases engagement and retention.
The Evolution of the Hexagon Pattern in Modern Workflows
Five years ago, the hexagon pattern was largely confined to niche design projects and biology textbooks. Today, it has entered mainstream use, driven by changes in how we consume information. Scrolling on mobile devices favors compact, tile-like layouts. Social media platforms reward visually distinct graphics that stop the thumb. Professionals who create slide decks, reports, or infographics now look for templates that stand out from the crowd. The hexagon pattern meets those needs without sacrificing readability.
Tools like Canva, Figma, and Adobe Illustrator now offer pre-built hexagon grids and templates, lowering the learning curve for non-designers. This democratization has allowed entrepreneurs, educators, and hobbyists to adopt the pattern in their daily work. A blogger summarizing a book’s core ideas might use five hexagons, each containing a key takeaway, arranged in a circular honeycomb. The result is more striking than a bullet list and more shareable on platforms like Pinterest or Instagram.
Shifting User Expectations: From Passive to Interactive
Audiences today expect more than static data. They want to explore, compare, and connect dots themselves. The hexagon pattern supports this shift because its modular nature can easily be adapted into interactive formats. In digital reports, each hexagon can become a clickable element that reveals deeper layers of information. On a website, a hexagon grid might serve as a navigation menu for different sections of a case study. This flexibility aligns with the trend toward data storytelling that puts the user in control.
Consider a creator who runs an online course on productivity. Instead of a linear syllabus, they could design a hexagonal overview where each hexagon represents a module: “Time Blocking,” “Task Prioritization,” “Energy Management,” and so on. The arrangement shows that the modules are not a strict sequence but a toolkit that learners can mix and match based on their needs. This reframing respects the way adults actually learn—nonlinearly and contextually.
Practical Implications for Creators and Professionals
Adopting the Infographics Hexagon Pattern can improve your communication in several concrete ways. First, it forces you to distill each point into a concise core idea. A hexagon has limited space, so you cannot cram in paragraphs. You must identify the essence of what you want to say, which benefits both you and your audience. Second, the pattern naturally encourages visual consistency. When you commit to a hexagon grid, you are also committing to a unified color scheme, font size, and icon style across all cells, which elevates the overall professionalism of your output.
For marketers, the hexagon pattern can be a powerful tool for presenting product features, customer journeys, or brand values in a way that feels fresh. A hexagonal layout for a product roadmap, for example, can show how different features interconnect to deliver a unified experience, rather than a simple timeline of releases. Entrepreneurs pitching to investors might use a hexagon infographic to summarize their business model, with each hexagon representing a key metric or value proposition. The pattern conveys that the business is a system, not just a list of features.
Realistic Recommendations for Getting Started
- Start with a clear narrative. Before arranging hexagons, map out the relationships between your content. Which ideas are central? Which are supporting? The hexagon pattern works best when there is a natural web of connections.
- Limit the number of hexagons. A honeycomb with too many cells becomes overwhelming. Typically, 5 to 12 hexagons is a manageable range. More than that, and you risk diluting the visual impact.
- Use color with intention. Assign a consistent color to each theme or category. Adjacent hexagons can share similar hues to indicate relatedness, while contrasting colors can highlight a key difference.
- Pair with concise text and symbols. Each hexagon should contain a short headline, a small icon, or a single data point. The surrounding white space is your friend—do not fill the entire shape with text.
- Test the layout on different devices. A hexagon grid that looks stunning on a desktop might appear cramped on a phone. Ensure your design scales gracefully, especially if you will share it online.
One common mistake is treating the hexagon pattern as a mere decorative element. If the arrangement does not reflect actual relationships in your data, it becomes visual noise rather than a communication tool. Always ask: does the pattern help my audience understand the connections, or does it just look trendy? Honest answers keep your work grounded and effective.
Beyond Trend: Why This Pattern Is Here to Stay
The hexagon pattern is not a passing fad driven by aesthetic preference. It responds to deeper shifts in how people process and share information. We are moving away from linear, top-down explanations toward networked, modular thinking. The hexagon pattern mirrors that mindset. It allows creators to present complex topics in a way that feels exploratory rather than instructional, empowering the viewer to engage on their own terms.
Moreover, the rise of generative AI and automated design tools will only increase the demand for modular layouts that can be quickly assembled and customized. Hexagon grids provide a consistent framework that algorithms can fill with content while still leaving room for human creativity. For professionals who want to stay ahead of the curve, learning to work with this pattern is a low-risk investment that pays off in more compelling visuals and clearer communication.
Whether you are a blogger summarizing trends, a business owner explaining your value proposition, or an educator designing a curriculum map, the Infographics Hexagon Pattern offers a versatile and proven structure. It respects your audience’s intelligence by showing how ideas connect, and it respects your time by being straightforward to implement with modern tools. Try it with your next project—you may find that a simple shift in shape unlocks a more powerful way to tell your story.